S
C
saulcross.com

UI Functionality

UI Design
Adjusting the bar-graph values.
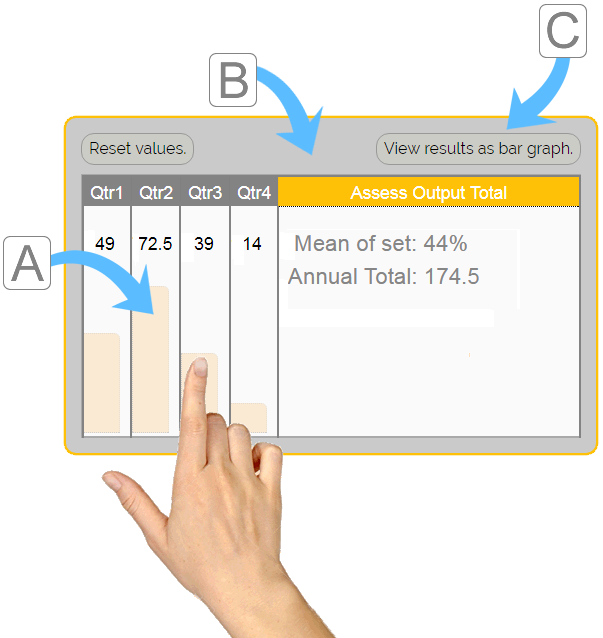
Inspired by the final look of the bar-graphs, I decided to further the project to develop an input UI. Once selected, the input UI will adjust the bar-graphs without having to edit the HTML.

A: Either using the mouse or a touch screen device, select the bar-graph value by adjusting the height of the tool tip proivded.

B: Once all four input values have been entered, then select "Assess Output Total".

C: To view the data as a responsive bar-graph click "View the results as a bar graph", and your web page will be updated.

View the UI design.

Dynamic Graphs & UI design

Included in the specification of the Energy Efficiency development for Warwick SU were a number of specific requirements. Mainly to reduce development time, as this was previously completed as a static image.

Independent of the number of entries whether rows or columns. The layout is both centred, responsive and can be updated quickly in simple HTML.

  • 3/11/2017 Data Input: 31.5%
  • 3/11/2017 Data Input: 66%
  • 3/11/2017 Data Input: 42%
  • 3/11/2017 Data Input: 79.5%
  • Average: 55%Total: 219

Data items 1 - 42017/18

  • 3/11/2017 Data Input: 74%
  • 3/11/2017 Data Input: 37%
  • 3/11/2017 Data Input: 89%
  • 3/11/2017 Data Input: 38%
  • Average: 60%Total: 238
0 10 20 30 40 50 60 70 80 90